A Fan Chart is good to show the uncertainty in future projections - usually, this grows the further forward to projection.
The following post walks through the steps to build a Fan chart using Vitaracharts for MicroStrategy.

1. The Fan Chart requires at least one attribute (for ex: Year and Quarter) or dimensions and three metrics (Revenue, Revenue Forecast, Lowbound, and Highbound). Place the attributes for the category and the metrics to columns and select “Vitara Line Chart”.

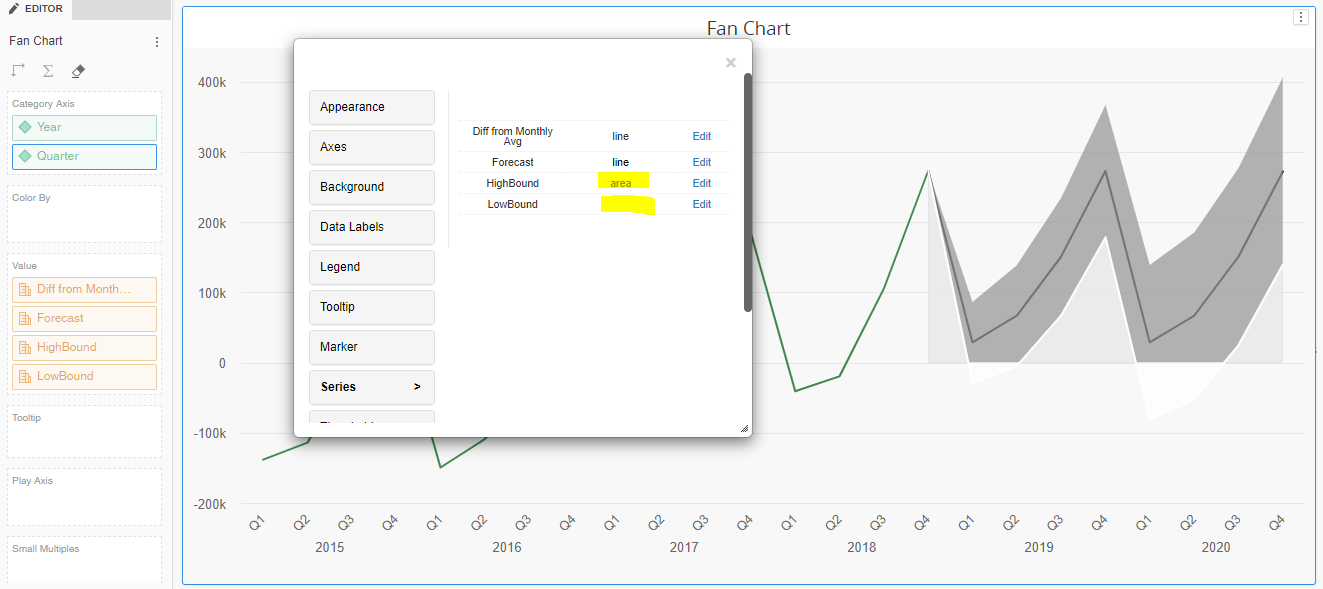
2. Use the EDIT option for Vitaracharts and navigate to the Series section then change the series from line to area for both the Lowbound and Highbound metrics and then change the Lowbound area color to match with the background of the chart as shown in the screen below.